Other graphs are possible in addition to the daily visualisation of expected and actual electricity consumption in the City of Zurich. These are based on the regression model and data from the city of Zurich’s open data catalogue (in German).
Electricity consumption 2018-2022
This graph compares measured values from recent years. Different views can be selected. Consumption or cumulative consumption can be displayed per quarter, month or week. Weekends and public holidays are not included and nor are external factors, such as weather data.
Electricity consumption in recent years
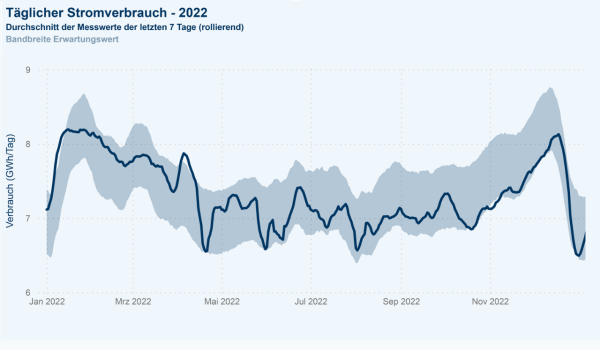
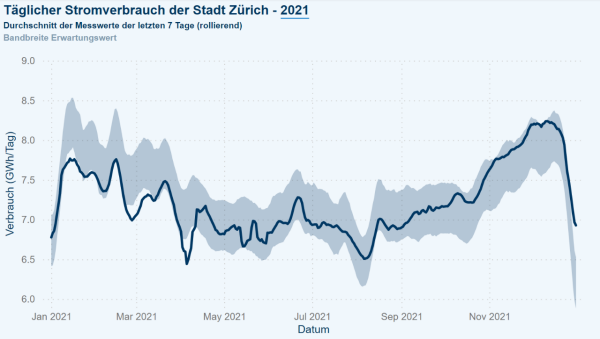
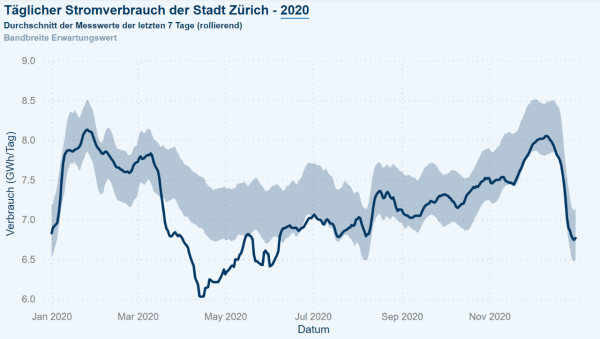
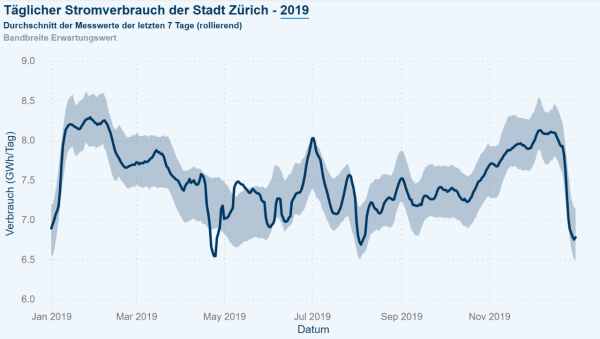
The following graphs show the dashboards for recent years. The calculations were done using the same method as for the current dashboard. The graph for 2020 shows the impact that COVID-19 measures had on electricity consumption in the spring.


